From Sea to Shining Sea | American Moving Trends from 2023 to 2025

California may have received 8.33% of our arrivals, but was it really the best state for moving? Our database of year-over-year and up-to-the-minute moving statistics revealed surprising trends in American migration.

You could be one of the 8.33% of Americans moving to California - or you could be one of the 12.77% of Californians trying to get out. But what states were really the most popular destinations from 2023 to 2025?

The iMoving research department analyzed our moving data to track some trends.

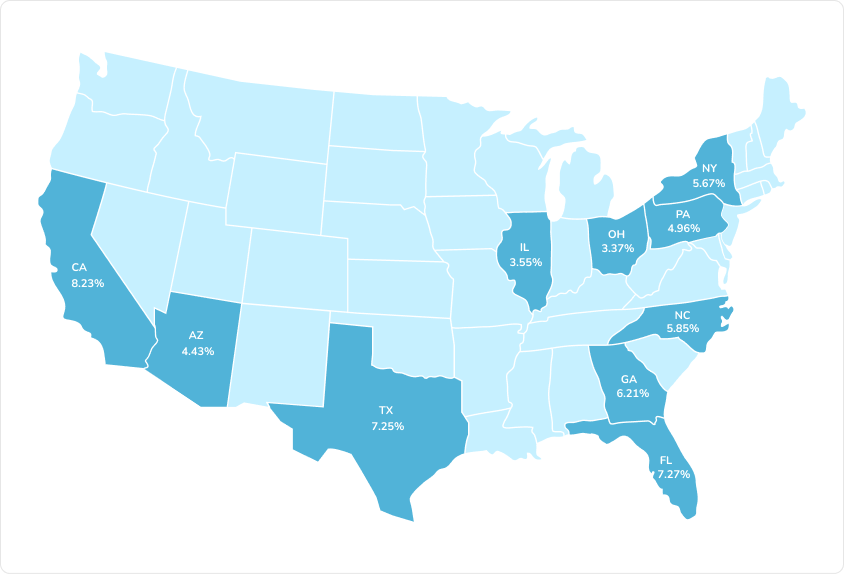
Here are some key takeaways:

  • Of all the state-to-state moves we processed between 2023 and 2025, 12.77% of those moves were leaving California.
  • Arizona, Ohio, Pennsylvania, and North Carolina saw significant amounts of net migration (they didn’t even rank in the top 10 for departures).
  • Florida and Texas are revolving doors. Their numbers for departures are pretty similar to their numbers for arrivals. (Florida saw 7.8% of our departures, but 7.27% of our arrivals. Texas saw 7.09% of our departures, but 7.27% of our arrivals.)
  • Los Angeles alone accounted for 1.23% of all departures nationwide, while Houston received 0.87% of all new arrivals.

iMoving has been helping Americans move for the past decade. Our team is made up of veteran movers and industry professionals, and we use our experience to make moving easier for customers across the country.

Between 2023 and 2025, 2,839 customers used iMoving to book and complete their relocations. Aside from finished moves, we also compiled moving industry data from thousands of quote requests, mover tariffs, and user activity across our marketplace. Using this real-world information, we were able to provide some intuitive insights about what places are popular, and what locations are losing people fast.

State to State Moving Trends: What are the Top 10 States People are Moving To?

For this first study, we wanted to focus on state-to-state relocations.

We narrowed it down to moves that took our customers to different states.

Then, we broke it down to a percentage of how many customers ended up where.

It’s worth mentioning that out of 2,839 completed moves, 569 moves took customers to different states. That means out-of-state relocations accounted for almost 20% of all the moves we handled (19.9%, to be more exact).

The 10 States Gaining the Most People by Percent of Booked Arrivals:

Choose Item

Percent of Arrivals:8.33%

Percent of Arrivals:7.27%

Percent of Arrivals:7.27%

Percent of Arrivals:6.21%

Percent of Arrivals:5.85%

Percent of Arrivals:5.67%

Percent of Arrivals:4.96%

Percent of Arrivals:4.43%

Percent of Arrivals:3.55%

Percent of Arrivals:3.37%

(Interesting fact: these top 10 states accounted for over 50% of all out-of-state moves. Wow.)
The data tells an interesting story. For all the trash people are talking, California is still getting new arrivals. Florida, Texas, Georgia, and North Carolina are pretty popular as well. 
Does this mean that those 5 states are experiencing net growth? Not exactly.Some states are like revolving doors, gaining people and losing them in equal share. Others are losing or gaining way more. That’s why we also looked at where people are leaving, too.

The 10 States Losing the Most People, by Percent of Booked Departures

Choose Item

Percent of Departures:12.77%

Percent of Departures:7.8%

Percent of Departures:7.09%

Percent of Departures:5.5%

Percent of Departures:5.32%

Percent of Departures:4.43%

Percent of Departures:3.72%

Percent of Departures:3.72%

Percent of Departures:3.19%

Percent of Departures:3.01%

California, Florida, and Texas are seeing departures as well as arrivals, but in California’s case, the departures far outweigh the amount of people moving in. Florida and Texas are also losing people - but they’re being replenished by arrivals that are pretty close to those departure numbers.


High Arrivals and Low Departures - These States Are Heating Up

Arizona, Ohio, Pennsylvania, and North Carolina were all on our top 10 list for destinations. These four states received a considerable percent of all out-of-state arrivals. However, they weren’t included on the top 10 list of states experiencing departures.
What does this tell us? That Arizona, Ohio, Pennsylvania, and North Carolina are all seeing high amounts of state-to-state migration, with very little people actually leaving. If you’re interested in real estate investing - or you just want to head to the next hot location - keep an eye on these states. Prices may start increasing accordingly.
This does kind of beg the question. If Arizona, Ohio, Pennsylvania, and North Carolina weren’t featured in our top 10 states experiencing departures, what states were seeing more people leaving, with very little new arrivals?
When we compared the top 10s we put together, we noticed that people were leaving New Jersey, Illinois, Michigan, and Colorado - but those states weren’t getting big numbers of new arrivals. This may hint at a downturn in the real estate market, and affordable housing for once.
Then, there are those “revolving doors”. We saw a lot of people leaving Texas and Florida, but a lot of people coming in to keep the numbers steady. As more native Texans and Floridians move out to be replaced by newcomers from California and New Jersey, the cultures of these states may shift accordingly.


How Far Were Americans Moving? A Look at In-State vs. Out of State Moves

With all the data available, we didn’t want to restrict ourselves to just looking at state to state moving trends. We also wanted to see how many Americans were choosing to move within their own states.
Between 2023 and 2025, 2,839 customers used iMoving to book moves and relocate. Of those 2,839 customers, 565 customers decided to move to a different state, while 2,274 decided to try their luck in the same state.


Choose Item

Percent of All Booked Moves:80.1%

Percent of All Booked Moves:19.9%

As you can see, in-state moving is much more popular than out of state moving. But every state is different, and all those in-state moves had to start somewhere. That’s why we zoomed in even further to get an idea of what cities were seeing more arrivals and more departures…


A Look at Local Moving: iMoving Moves by City

Out of 2,839 booked moves, 642 were within the same city. This gave us an interesting statistic: The amount of people choosing to stay in the same town was actually pretty close to the amount of people choosing to move to a completely different state (at least percentage wise).

Choose Item

Percent of All Booked Moves:22.61%

Percent of All Booked Moves:77.39%

But what about the cities themselves? Which cities were the biggest losers from 2023 to 2025, and which cities saw the most of our new arrivals? Let’s take a look.


The 10 Cities Losing the Most People, by Percent of Booked Departures on iMoving

Choose Item

Percent of All Booked Departures:1.23%

Percent of All Booked Departures:0.96%

Percent of All Booked Departures:0.87%

Percent of All Booked Departures:0.77%

Percent of All Booked Departures:0.73%

Percent of All Booked Departures:0.59%

Percent of All Booked Departures:0.5%

Percent of All Booked Departures:0.46%

Percent of All Booked Departures:0.46%

Percent of All Booked Departures:

:0.46%

According to our records, there are 19,495 incorporated cities and towns across the entire United States. So if Los Angeles saw 1.23% of all of our departures, that’s actually a pretty big share of the market!
But where are people moving to? We took a look at what cities saw the most arrivals as well.

The 10 Cities Gaining the Most People, by Percent of Booked Arrivals on iMoving

Choose Item

Percent of All Booked Arrivals:0.87%

Percent of All Booked Arrivals:0.73%

Percent of All Booked Arrivals:0.64%

Percent of All Booked Arrivals:0.55%

Percent of All Booked Arrivals:0.5%

Percent of All Booked Arrivals:0.5%

Percent of All Booked Arrivals:0.5%

Percent of All Booked Arrivals:0.46%

Percent of All Booked Arrivals:0.36%

Percent of All Booked Arrivals:0.36%

It’s interesting to note that there are three different Texan cities on the top 10 list of destinations by city. Combining Houston’s 0.87%, Austin’s 0.64%, and San Antonio’s 0.55% gives us 2.06% of all arrivals, all heading to major metropolitan areas of the Lone Star State.


The Most Popular Moving Routes in America

Some moving routes are more popular than others, which may influence the price and availability if you decide to move soon. Here were the most popular moving routes for state to state relocations, as shown by our year-to-year data:

Choose Item

Percent of All State to State Moves:1.77%

Percent of All State to State Moves:1.24%

Percent of All State to State Moves:1.06%

Percent of All State to State Moves:0.88%

Percent of All State to State Moves:0.88%

These 5 routes accounted for 5.83% of all of our state to state traffic. If you’re trying to move from California to Texas (or just trying to escape from New Jersey) - take heart: You’re definitely not alone.


Year-to-Year Comparison: How Did Moving Trends Change Between 2023 and 2024?

We booked 2,839 moves between 2023 and 2025. That included 1,454 moves in 2023, and 1,320 in 2024. Using this data, we were able to determine which states were receiving the biggest percentage of arrivals in 2023, versus which states were receiving the biggest percentage of arrivals in 2024.
Here’s how moving trends changed between 2023 and 2024, based on our year-to-year data:
Arrivals by State: 2023 vs 2024

Choose Item

Percent of 2023 Arrivals:0%

Percent of 2024 Arrivals:0%

Percent of 2023 Arrivals:2.12%

Percent of 2024 Arrivals:1.92%

Percent of 2023 Arrivals:0.85%

Percent of 2024 Arrivals:0.64%

Percent of 2023 Arrivals:4.24%

Percent of 2024 Arrivals:4.79%

Percent of 2023 Arrivals:7.63%

Percent of 2024 Arrivals:9.27%

Percent of 2023 Arrivals:3.39%

Percent of 2024 Arrivals:0.96%

Percent of 2023 Arrivals:0.85%

Percent of 2024 Arrivals:1.6%

Percent of 2023 Arrivals:0.42%

Percent of 2024 Arrivals:0.64%

Percent of 2023 Arrivals:0%

Percent of 2024 Arrivals:1.6%

Percent of 2023 Arrivals:7.63%

Percent of 2024 Arrivals:7.03%

Percent of 2023 Arrivals:5.08%

Percent of 2024 Arrivals:7.35%

Percent of 2023 Arrivals:0%

Percent of 2024 Arrivals:0%

Percent of 2023 Arrivals:0%

Percent of 2024 Arrivals:0.96%

Percent of 2023 Arrivals:0.42%

Percent of 2024 Arrivals:0.32%

Percent of 2023 Arrivals:5.08%

Percent of 2024 Arrivals:2.24%

Percent of 2023 Arrivals:2.54%

Percent of 2024 Arrivals:1.6%

Percent of 2023 Arrivals:1.27%

Percent of 2024 Arrivals:0.96%

Percent of 2023 Arrivals:0.85%

Percent of 2024 Arrivals:0%

Percent of 2023 Arrivals:0%

Percent of 2024 Arrivals:0%

Percent of 2023 Arrivals:1.69%

Percent of 2024 Arrivals:1.92%

Percent of 2023 Arrivals:3.39%

Percent of 2024 Arrivals:2.56%

Percent of 2023 Arrivals:0%

Percent of 2024 Arrivals:0.64%

Percent of 2023 Arrivals:0.85%

Percent of 2024 Arrivals:0.32%

Percent of 2023 Arrivals:1.69%

Percent of 2024 Arrivals:1.28%

Percent of 2023 Arrivals:0.85%

Percent of 2024 Arrivals:0.64%

Percent of 2023 Arrivals:0.85%

Percent of 2024 Arrivals:0.64%

Percent of 2023 Arrivals:0.42%

Percent of 2024 Arrivals:0.96%

Percent of 2023 Arrivals:6.78%

Percent of 2024 Arrivals:5.11%

Percent of 2023 Arrivals:0%

Percent of 2024 Arrivals:0%

Percent of 2023 Arrivals:0.85%

Percent of 2024 Arrivals:0.32%

Percent of 2023 Arrivals:0.42%

Percent of 2024 Arrivals:0.32%

Percent of 2023 Arrivals:5.08%

Percent of 2024 Arrivals:1.28%

Percent of 2023 Arrivals:0.42%

Percent of 2024 Arrivals:0.64%

Percent of 2023 Arrivals:1.69%

Percent of 2024 Arrivals:1.92%

Percent of 2023 Arrivals:4.24%

Percent of 2024 Arrivals:6.71%

Percent of 2023 Arrivals:2.12%

Percent of 2024 Arrivals:4.47%

Percent of 2023 Arrivals:0.85%

Percent of 2024 Arrivals:0.96%

Percent of 2023 Arrivals:3.81%

Percent of 2024 Arrivals:1.92%

Percent of 2023 Arrivals:4.24%

Percent of 2024 Arrivals:4.79%

Percent of 2023 Arrivals:1.27%

Percent of 2024 Arrivals:0.64%

Percent of 2023 Arrivals:0.85%

Percent of 2024 Arrivals:1.6%

Percent of 2023 Arrivals:0%

Percent of 2024 Arrivals:0.64%

Percent of 2023 Arrivals:2.12%

Percent of 2024 Arrivals:0.96%

Percent of 2023 Arrivals:5.93%

Percent of 2024 Arrivals:8.31%

Percent of 2023 Arrivals:0.85%

Percent of 2024 Arrivals:0%

Percent of 2023 Arrivals:0.85%

Percent of 2024 Arrivals:2.56%

Percent of 2023 Arrivals:0.85%

Percent of 2024 Arrivals:0.32%

Percent of 2023 Arrivals:3.39%

Percent of 2024 Arrivals:2.88%

Percent of 2023 Arrivals:0.42%

Percent of 2024 Arrivals:1.92%

Percent of 2023 Arrivals:0.85%

Percent of 2024 Arrivals:0.96%

Percent of 2023 Arrivals:0%

Percent of 2024 Arrivals:0%

Judging from the data, some states are much more popular than others, even from 2023 to 2024. Where does your state stack up?


A Look Ahead at 2025

Where are people moving in 2025? The year’s not up yet. But every month, we analyze new patterns and track the latest moving trends across the country. We found some interesting data for 2025 so far, including the state that’s already in the lead for the most departures.

Want up-to-the minute statistics? Take a look at our live data page, and see what the future of American moving looks like.

Methodology: How iMoving Built this Study

Our moving insights are based on real-world data and aggregated information from thousands of quote requests. We based this study on successfully completed moves, including over 3,000 verified mover tariffs and user activity from across our entire marketplace.
Thousands of customers have used iMoving to plan and book local and out of state relocations. We use these statistics to update our database every month, and this exclusive information allows us to track the latest moving trends.


Make State to State Moving Easier with iMoving

iMoving is the only platform that lets you shop around, compare prices, and book a moving company from the comfort of your phone or computer. We’ve got a marketplace with over 1000 moving companies - all vetted and verified by our research department - and we’ve got an easy-to-use moving cost calculator to make it even easier.
Ready to get out of town? We’re ready to help. Tell us more about your move, and we’ll get you on the road.


Harrison Gough

Harrison has been writing for real estate and moving companies for the past three years, but his knowledge isn't just from behind a desk. Having moved over a dozen times himself, sometimes with professional help and sometimes on his own, he's learned firsthand what makes moving smooth and what makes it stressful. When he's not writing, he's looking into ways to make his next move simpler.

Get all moving services you need in one place

Shop Our Services